Uptime Monitoring Explained: How Website Availability Checks Actually Work
Uptime monitoring continuously checks your website, application, or API to ensure it remains available and performs as expected. By detecting outages, slow responses, and service failures in real time, teams can respond quickly, reduce downtime, and deliver a better user experience.
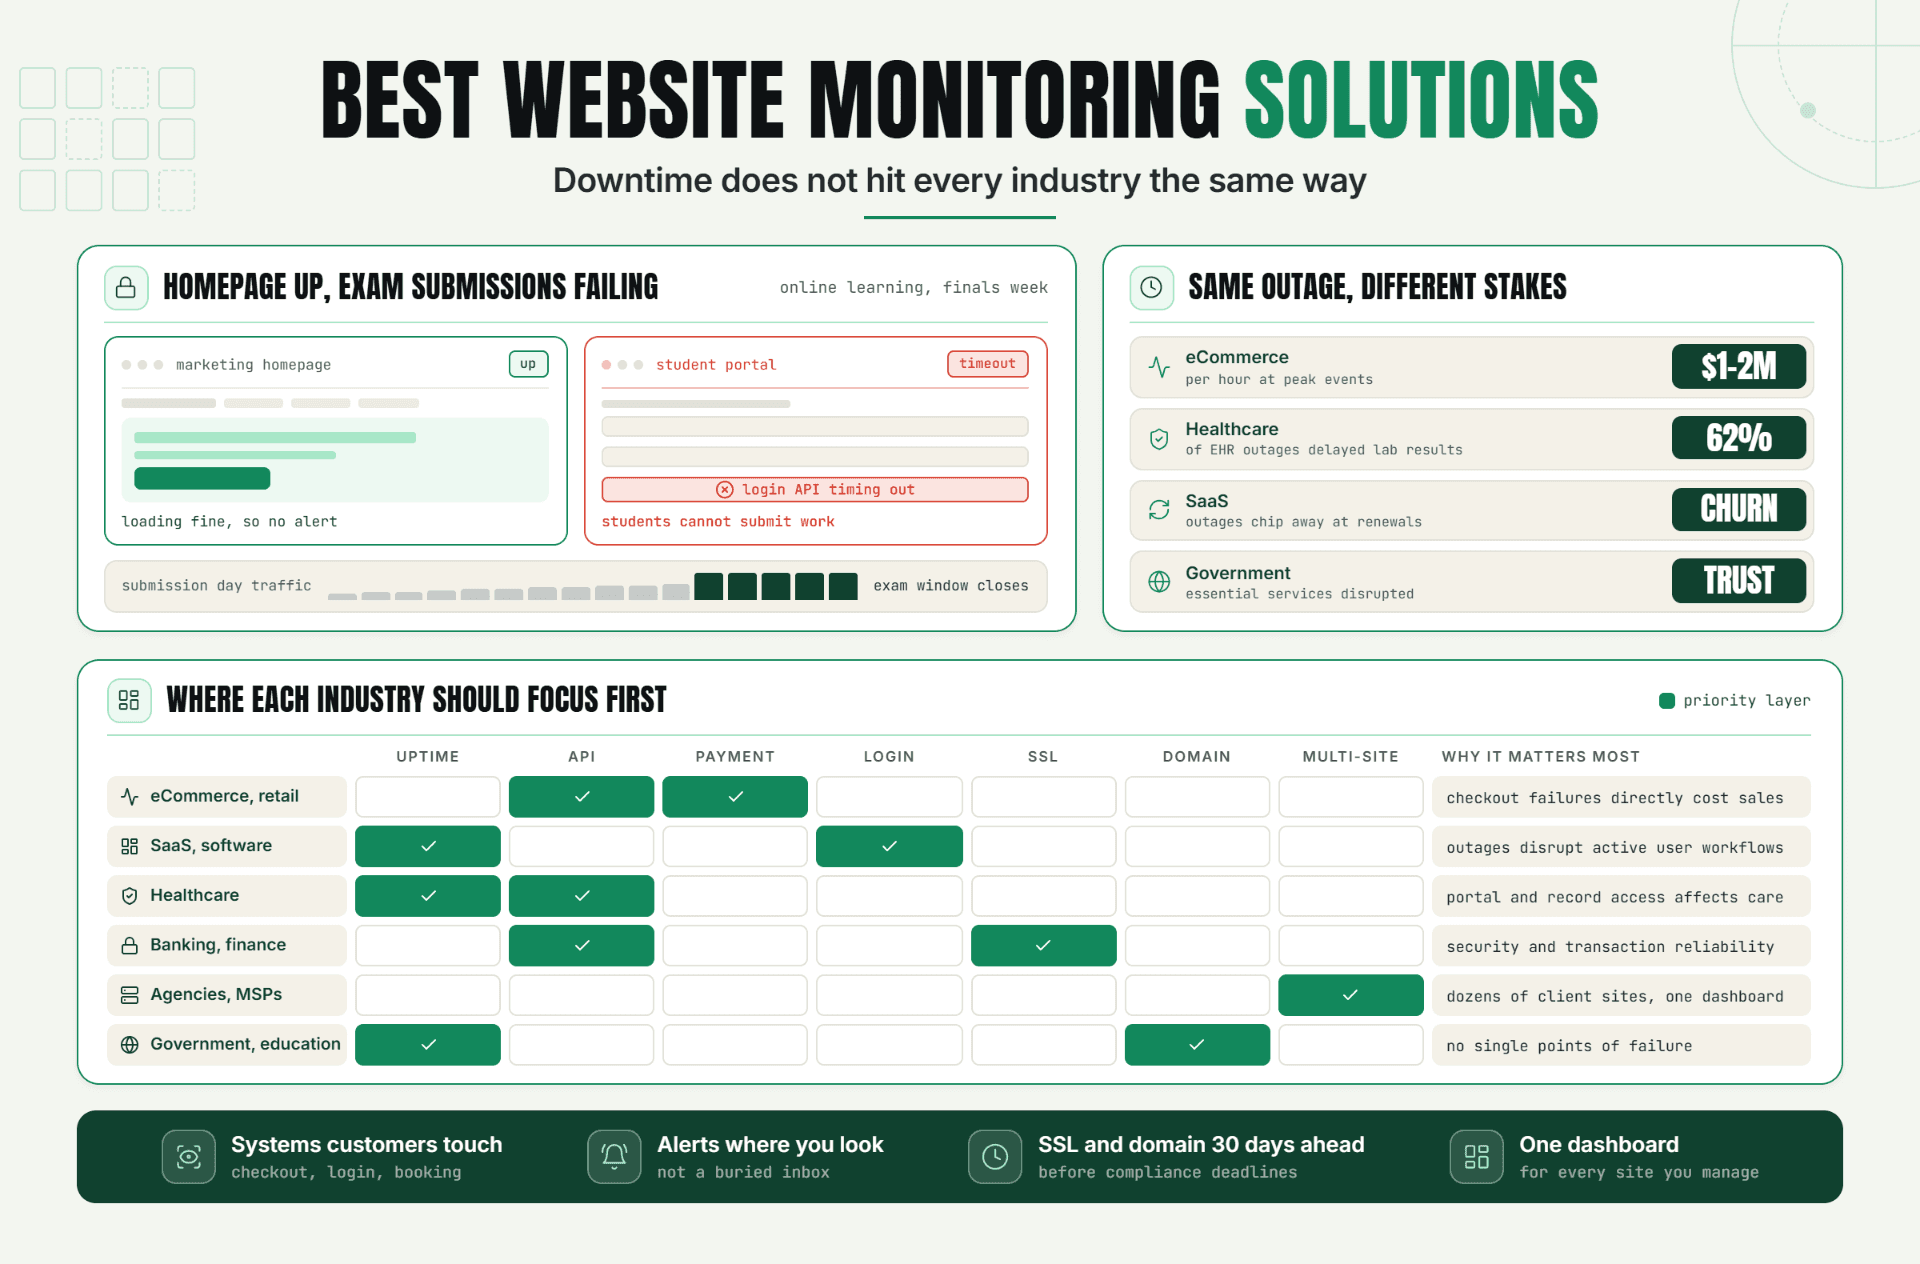
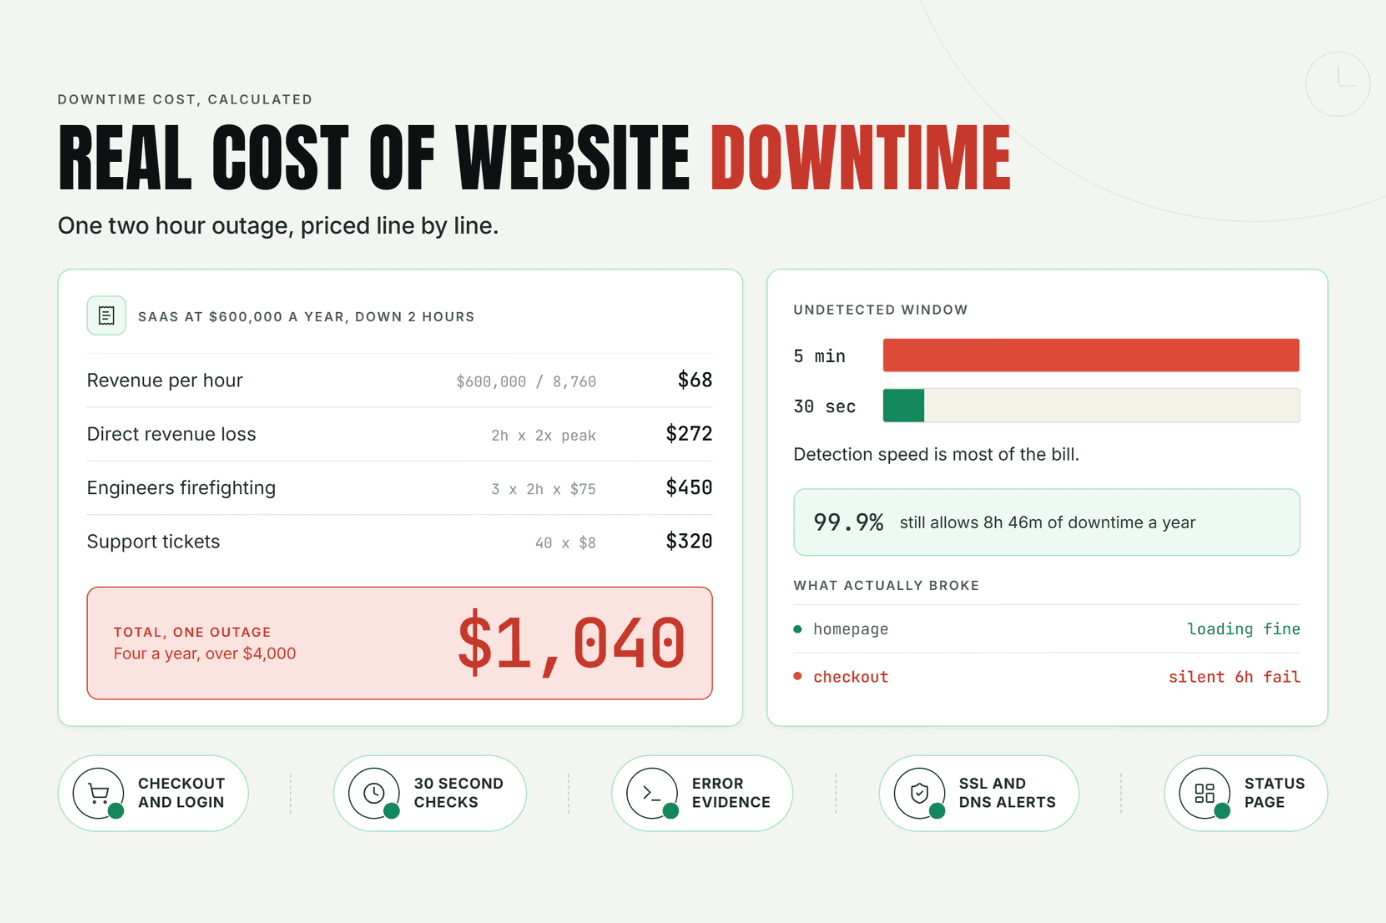
A website can be technically "running" while still failing customers. Pages may load slowly, APIs may return errors, a payment service may be unavailable, or a critical database connection may fail. Uptime monitoring helps teams detect these problems before they become prolonged customer-facing incidents.
For developers, founders, website owners, and junior DevOps engineers, uptime monitoring provides a simple way to continuously verify that important websites and services are available and responding as expected.
The Operational Risks Teams Face Without Effective Uptime Monitoring
Without reliable monitoring, teams often discover website problems through customer complaints, social media posts, or internal reports.
This creates several risks:
- Longer downtime: Problems can remain unnoticed for minutes or hours.
- Poor customer experience: Visitors may encounter broken pages, failed requests, or unavailable services.
- Revenue loss: Downtime can prevent purchases, registrations, bookings, or other conversions.
- Slow incident response: Developers may spend valuable time determining whether an issue is real.
- Missed dependencies: A website may be available while an important API or third-party service is failing.
- Alerting gaps: Teams may only discover failures after customers have already been affected.
Effective website monitoring solutions continuously test critical endpoints and notify the appropriate people when predefined conditions are met.
How Uptime Monitoring Works
At a basic level, an uptime monitor sends a request to a website or service at a defined interval and evaluates the response.
For example, an HTTP monitor might request:
https://example.com The monitoring system can then check several characteristics of the response:
- Connection success: Was the server reachable?
- HTTP status code: Did it return an expected response such as
200 OK? - Response time: Did the request complete within the configured threshold?
- Response content: Does the returned page contain expected text or data?
- SSL/TLS validity: Is the certificate valid and not approaching expiration?
- Availability across locations: Does the service respond successfully from different monitoring locations?
Understanding Uptime Checks
An uptime check is essentially a recurring test designed to answer a simple question:
Is this service available and behaving as expected?
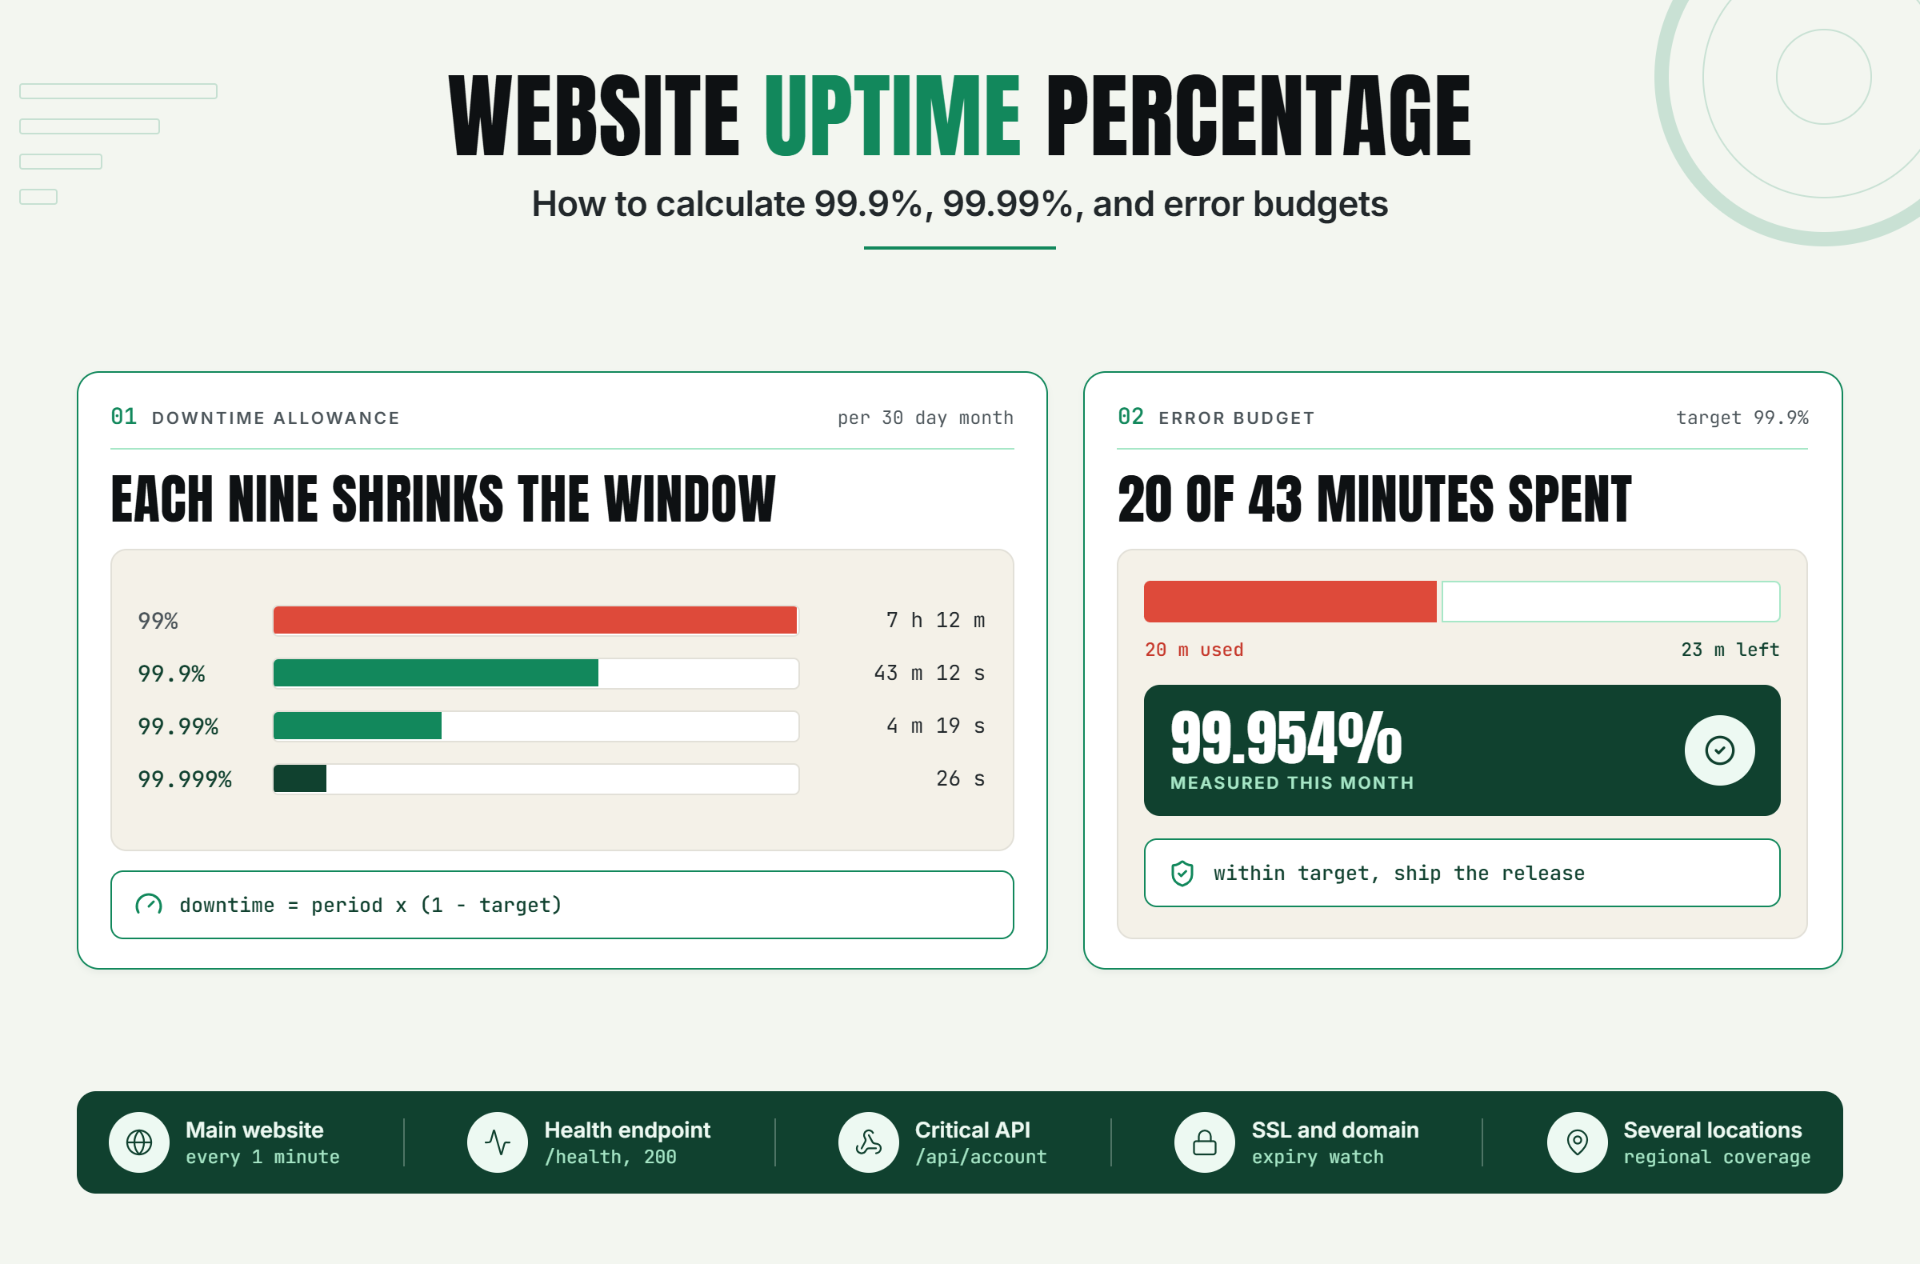
The frequency depends on how critical the service is This guide explainshow often you should monitor a website based on its business importance and acceptable detection time.. A business-critical application may require checks every minute, while a lower-priority service might be checked less frequently.
However, frequency alone does not make monitoring effective. A check must also validate the right conditions.
HTTP Monitoring
HTTP monitoring is one of the most common approaches for websites and APIs.
A basic HTTP check might consider the service healthy when:
- The server responds.
- The HTTP status code is expected.
- Response time is below the configured threshold.
- Optional content validation succeeds.
| Check | Expected Result |
|---|---|
| HTTP status | 200 |
| Response time | Under 2 seconds |
| Content | Expected page text exists |
| SSL | Valid certificate |
Thresholds and Failure Detection
A monitoring system needs clear rules for deciding when a service should be considered unhealthy.
- Response time above 3 seconds: performance warning
- HTTP 500: server error
- HTTP 404: unexpected endpoint response
- Connection timeout: availability failure
- Content validation failure: application-level failure
To reduce false-positive alerts, monitoring systems can require multiple failed attempts before triggering a website downtime alert..
For example:
Check every 60 seconds - require two consecutive failures - send an alert.
This helps distinguish a temporary network issue from a sustained outage.
Diagnosis: Availability vs. Application Failure
One important benefit of effective uptime monitoring is that it can provide clues about the type of failure.
Scenario 1: HTTP 500
The server is reachable, but the application is returning an internal server error.
Scenario 2: Timeout
The monitoring system cannot receive a response within the configured period. Possible causes include network problems, overloaded infrastructure, or an unavailable service.
Scenario 3: HTTP 200 but Incorrect Content
The server responds successfully, but the application may be broken. For example, a maintenance page or error page could return status 200.
This is why combining status-code checks with response-time and content validation can provide more meaningful monitoring.
A Realistic Production Scenario and Recommended Monitor Setup
Imagine an e-commerce website where customers can browse products, add items to their cart, and complete payments.
A basic monitor might check only:
GET / That confirms the homepage responds, but it doesn't tell you whether critical customer journeys are working. Transaction monitoring for login, signup and checkout flows verifies whether customers can complete these important actions from beginning to end..
A stronger setup could include:
Monitor 1: Homepage
- Type: HTTP
- Frequency: Every 1 minute
- Expected status: 200
- Response-time threshold: Defined based on normal performance
- Content validation: Expected page content
Monitor 2: API Health Endpoint
- Type: HTTP
- Endpoint:
/api/health - Expected status: 200
- Response-time threshold: Defined according to application requirements
Monitor 3: Critical API
Follow this API monitoring guide to configure response-code, latency, content and authentication checks for critical endpoints.
For example:
GET /api/products Validate:
- HTTP status
- Response time
- Expected response structure or content
Monitor 4: SSL Certificate
Track certificate validity and receive an alert before expiration.
The goal isn't to monitor every URL. Instead, identify the services whose failure would have the greatest impact on customers or the business.
Best Practices for Coverage, Check Frequency, Validation, Ownership, and Escalation
1. Monitor Critical User Journeys
Start with the pages and endpoints that matter most.
For an e-commerce application, this might include:
- Homepage
- Product API
- Authentication
- Cart
- Checkout
- Payment-related endpoints
2. Choose an Appropriate Check Frequency
More frequent checks provide faster detection but can generate additional monitoring traffic.
Choose frequency based on:
- Business criticality
- Expected traffic
- Service architecture
- Acceptable detection time
3. Validate More Than HTTP Status
A200 OK response does not always mean the application is healthy. Where appropriate, validate:
- Response content
- Response structure
- Response time
- SSL status
- Important application conditions
4. Use Multiple Monitoring Locations
A service may be accessible from one network location but unavailable from another.
Monitoring from multiple geographic or network locations can help distinguish:
- Global outages
- Regional connectivity problems
- DNS issues
- Routing problems
5. Assign Ownership
Every critical monitor should have a clear owner.
When an alert fires, the team should know:
- Who receives it?
- Who investigates?
- Who escalates it?
- What happens if the first responder is unavailable?
6. Design Useful Escalation
Not every alert needs the same urgency.
A critical production outage may require immediate notification, while a minor performance degradation could be handled during normal working hours.
7. Review Monitors Regularly
Applications change. Endpoints are removed, domains change, and architectures evolve.
Review your monitoring configuration whenever major infrastructure or application changes are introduced.
Common Mistakes: Weak Checks, Noisy Alerts, Missing Dependencies, and Poor Routing
Mistake 1: Monitoring Only the Homepage
A working homepage doesn't prove that APIs, authentication, checkout, or other critical services work.
Better approach: Monitor important services and user journeys.
Mistake 2: Treating Every Failure as an Outage
A single failed request can result from a temporary network problem.
Better approach: Use sensible failure thresholds and consecutive-failure rules.
Mistake 3: Creating Too Many Alerts
Excessive notifications can lead to alert fatigue.
Better approach: Prioritize actionable alerts and route them according to severity.
Mistake 4: Checking Only HTTP Status Codes
An HTTP 200 response can still contain incorrect or unusable content.
Better approach: Add content or response validation when appropriate.
Mistake 5: Ignoring Dependencies
Your website may be online while a critical external API, DNS provider, payment provider, or other dependency is unavailable.
Better approach: Monitor critical dependencies where practical and document their role in your application.
Mistake 6: No Clear Alert Ownership
An alert that nobody owns is unlikely to result in a fast response.
Better approach: Define ownership and escalation before an incident occurs.
Turn Availability Into Something You Can Measure
Uptime monitoring provides a practical foundation for improving website reliability. Instead of waiting for customers to report an outage, teams can continuously test critical services and receive actionable notifications when something goes wrong.
The best monitoring strategy isn't necessarily the one with the largest number of checks. It is the one that reliably detects meaningful failures, minimizes false alerts, and clearly connects incidents to the people responsible for resolving them.
If you're starting from scratch, begin with your most important production website or API, define what “healthy” means, and configure your first reliable uptime check.
Start Monitoring Your Website
Ready to put uptime monitoring into practice?
Start your 30-day Statixoup trial and configure your first monitor. Begin with your most critical website or API, define the expected response, and set up alerts so your team can respond quickly when availability changes.
Follow Statixoup
Enjoyed this post? Follow us for uptime monitoring tips, product updates, and new articles.
Post a Comment

Frequently Asked Questions
Related Blogs